In September 2026, we tested 400 automotive searches in Australian Google results. AI Overviews appeared in 354 of them, or 88.5%. We wanted to see which searches returned AI answers, how AI Mode handled the next question, and whether Google kept the information relevant to cars sold here.
So we also worked through 40 AI Mode conversations, reviewed 509 automotive results in Ahrefs Brand Radar, and ran a separate set of 300 local searches for mechanics, car servicing and repairs.
As a few examples: A simple Tesla search became a discussion about NSW drive-away prices. An Everest and Prado comparison narrowed down to seven seats and towing a trailer in secondary search. We also found Australian pricing alongside overseas references, a UK Mazda grade in an Australian answer, and a Hyundai Kona answer with the wrong ANCAP rating.
It’s common knowledge that AI answers aggregate incorrect information or outright hallucinate. So these findings just reinforce the fact that brands need to have 100% concrete control over their product details, down to the spec line.
Key Takeaways
- AI Overviews appeared in 88.5% of our 400 selected searches, including every comparison query.
- AI Mode asked about budget in 60% of the opening answers across our 40 test conversations.
- We found overseas specifications and factual errors, including a UK Mazda grade and an incorrect Kona ANCAP rating.
- Official car-brand websites were cited in at least 40.9% of the 232 matched answers we reviewed.
Table Of Contents
- What We Searched For
- Australian Automotive Results From This Study
- Pointy End Detail = Higher AI Overview Frequency
- AI Overviews In Local Automotive Searches
- How AI Mode Took The Search Further
- Which Sources Did Google Cite?
- Australian Searches Can Include Overseas Information
- Errors And Missing Details In The Answers
- What Automotive Brands And Publishers Can Do
- About The Research
What We Searched For
We started with the sorts of searches you’d use while looking for a car. Some were just a model name, such as “subaru forester”. Others were broader, like “hybrid suvs”, or more specific, like “hybrid suv under 50k”.
There were 80 searches in each of the five groups below. “Powertrain” just means how the car is powered, such as petrol, hybrid or electric.
| Search Group | What We Included | Examples We Tested |
|---|---|---|
| Specific models | A named model, with or without a year, price, review or feature question. | “subaru forester”; “toyota rav4 price australia”; “hyundai kona hybrid 2026”; “2026 ford everest review” |
| Brand ranges and powertrains | A manufacturer’s range, technology or available models, without focusing on one named model. | “subaru evs”; “toyota hybrids”; “kia electric cars”; “tesla model prices” |
| Vehicle categories | An unbranded type of vehicle, such as a small SUV, electric car or ute. | “hybrid suvs”; “electric cars in australia”; “small suvs”; “utes in australia” |
| Needs and constraints | A job the car needs to do, a budget or capacity limit, or a request for the best option. | “best suv for towing”; “hybrid suv under 50000”; “car with biggest boot space”; “most reliable used suv australia” |
| Comparisons | An explicit comparison of models, powertrains, vehicle types or costs. | “forester vs rav4”; “hybrid vs electric suv”; “electric vs petrol car cost”; “compare the best hybrid suvs in australia” |
Take those hybrid SUV searches. Someone typing “hybrid suvs” has left the field wide open. Add “under 50000” and the price becomes part of the decision. Change it to “hybrid vs electric suv” and you’re asking about the trade-offs between two options.
This is the type of thing that secondary search introduces in Google’s AI products. Your content needs to follow those differences. A list of models can answer the first search. The budget search needs prices and eligible variants. The comparison needs to explain what you gain and give up with each powertrain.
A buyer’s decision may then rest on an answer 3, 4, 5 prompts deep into a conversation. Brands and products drop in and out of these follow ups depending on the detail available to Google’s crawlers.
The model group covered 40 models sold by Australian OEMs, with two searches for each. We built the wider list using Ahrefs keyword research and selected it before collecting results, so we weren’t choosing queries because we already knew they had an AI Overview.
Download all 400 queries and their AI Overview results.
Australian Automotive Results From This Study
88.5% of our selected automotive searches returned an AI Overview. This is high! I was expecting it to be high but not 88.5% high.
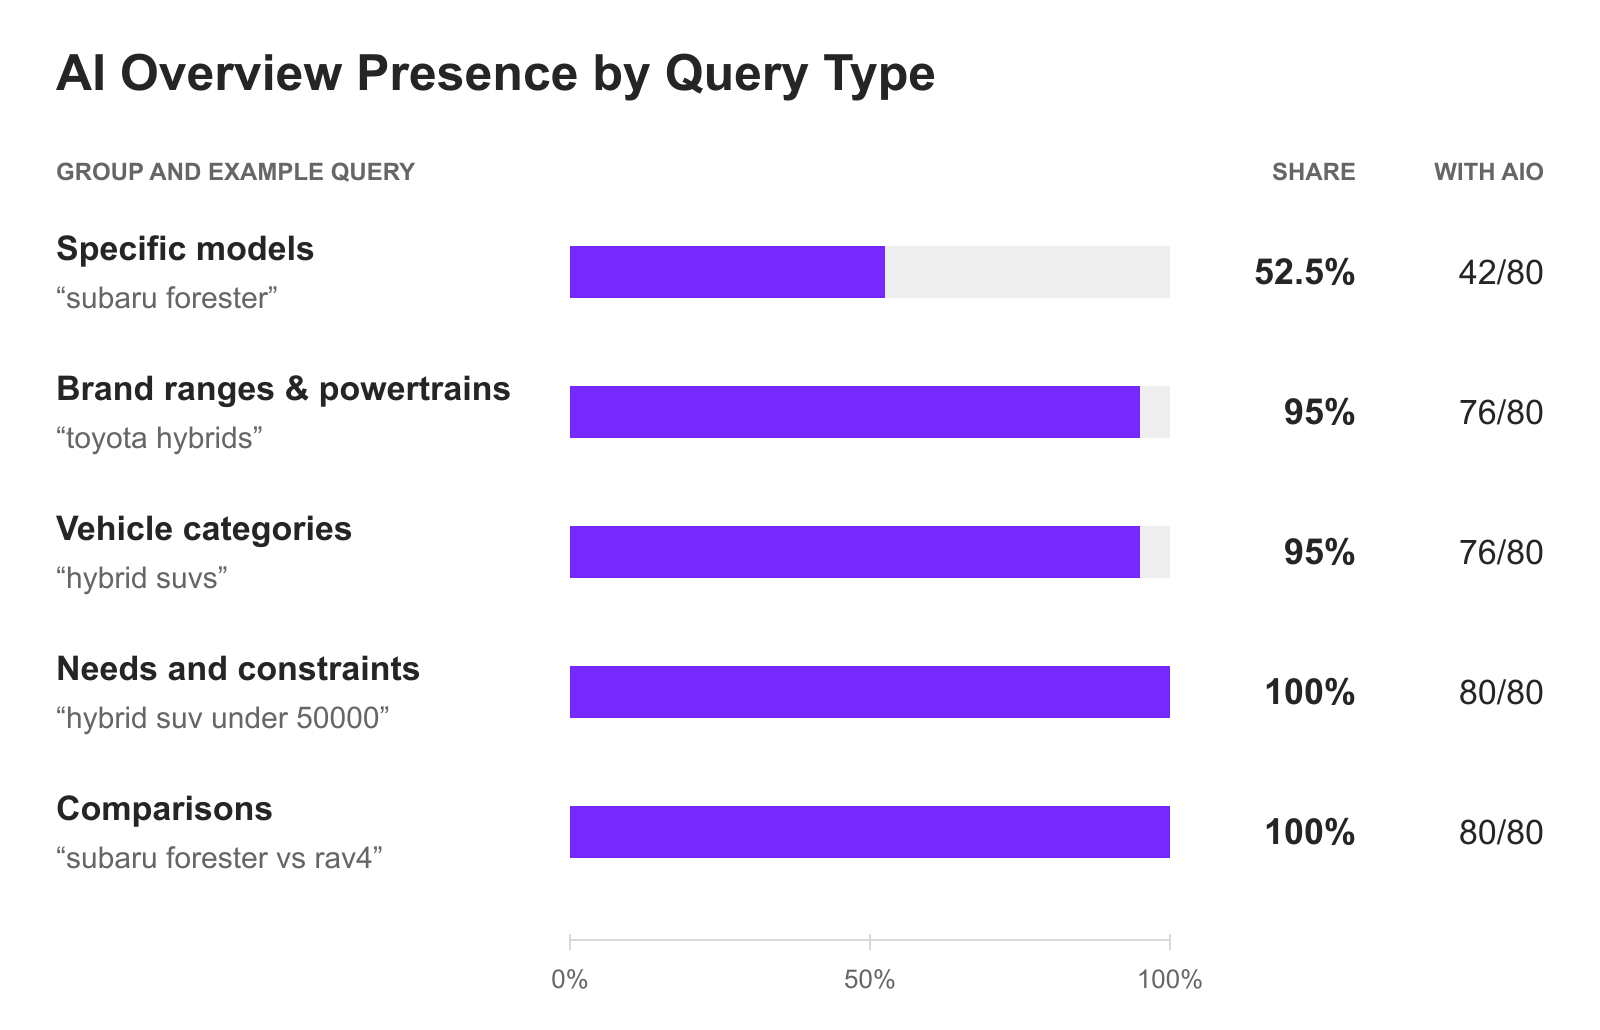
Comparisons and searches with buying requirements returned one every single time in their respective 80-query groups. Model searches were closer to half, which I’d argue is even too much on a “brand exact” product search.
Below are the figures you can cite. The table shows which part of the research each number comes from. Our vehicle searches and AI Mode conversations took place in September 2026. The Brand Radar answers were saved on different dates, mostly in August and September.
| Finding | Result | Sample And Scope |
|---|---|---|
| AI Overviews across the full search panel | 354/400 (88.5%) | Selected Australian automotive queries, with 80 in each of five groups. |
| AI Overviews for specific-model searches | 42/80 (52.5%) | Model names and model-specific searches, including price, year and feature queries. |
| AI Overviews for brand ranges and powertrains | 76/80 (95%) | Selected make-led searches such as “toyota hybrids” and “subaru evs”. |
| AI Overviews for vehicle categories | 76/80 (95%) | Selected unbranded searches such as “hybrid suvs” and “small suvs”. |
| AI Overviews for needs and constraints | 80/80 (100%) | Selected searches involving requirements, budgets or recommendations. |
| AI Overviews for comparisons | 80/80 (100%) | Selected comparisons of models, powertrains and vehicle types. |
| Initial AI Mode answers asking about budget | 24/40 (60%) | Forty researcher-run conversations; the initial answer was assessed in each. |
| Initial AI Mode answers asking about size, space or seating | 19/40 (47.5%) | The same 40 initial answers; question categories can overlap. |
| Initial AI Mode answers asking about use or driving distance | 15/40 (37.5%) | The same 40 initial answers; these are prompts we saw, not a survey of buyers. |
| YouTube citations in AI Mode | 71/116 (61.2%) | One saved AI Mode answer for each of 116 matched automotive questions. |
| YouTube citations in AI Overviews | 34/116 (29.3%) | The same 116 questions, with one saved AI Overview answer for each. |
| Drive citations in AI Mode | 53/116 (45.7%) | The matched Brand Radar set; each domain counts once per answer. |
| Drive citations in AI Overviews | 16/116 (13.8%) | The same matched questions; provider snapshot dates differ between products. |
| Official car-brand websites cited in AI Mode | 49/116 (42.2%) | Matched Brand Radar answers with at least one verified official vehicle-brand website citation. |
| Official car-brand websites cited in AI Overviews | 46/116 (39.7%) | Matched Brand Radar answers with at least one verified official vehicle-brand website citation. |
Source: Intellar, Australian automotive AI search study, September 2026. Download the statistics, calculations and sample notes.
These figures come from our own research. For broader industry data on search, AI, reviews and local SEO, see our automotive SEO statistics.
These percentages describe the searches we tested. We gave each group equal space, so 88.5% isn’t an estimate for all Australian car searches. We also counted an AI Overview wherever it appeared on the page, which doesn’t necessarily mean it was the first thing a searcher saw.
In many cases on a brand + model query, the AIO is actually mid-page, allowing the traditional blue links to take the SERP real estate up top. That said, Google still insists on shoving their AI answer in there.
Pointy End Detail = Higher AI Overview Frequency
Model searches returned an AI Overview 52.5% of the time. Comparisons on the other hand returned one 100% of the time. That’s a 47.5 percentage-point gap within our test.
It seems to be that the more detail you give Google, or the more entities you base query requires Google’s LLMs to visit, the higher chance of an AI Overview appearing there is.
This makes sense on a brand + model comparison for example, as LLMs off the bat need to check 4 entities.
Based on this dataset, if you’re only tracking prompts for the model names you sell, I’d expand that list. It’s very likely you also appear on competitor queries, partiuclarly in automotive where comparisons are such a natural part of the buyer jounery.
Our searches around budgets, requirements and comparisons all returned AI answers. Brand and category searches were close behind at 95% each. Basically, there are plenty of searches to work on before someone settles on a model.
There’s another detail to watch when reporting on AI Overviews. Being present and being at the top of the page are different things.
An Ahrefs study of 10 million results pages containing AI Overviews found that 8.64% placed the overview outside position one, with the lowest at position six. That was a separate study across ten countries in July 2025. We didn’t measure positions across our 400 searches.
For a query like “toyota hybrids”, I’d record what appears above the AI answer as well as whether there’s one at all. Several manufacturer or dealer results above it give you a very different page from an AI answer at the top.
Search Console won’t show you that full layout either. Google assigns the same position to an AI Overview and the links within it. Save a screenshot of the surrounding results when you check, including the device and screen size, so you can see what someone encounters before scrolling.
AI Overviews In Local Automotive Searches
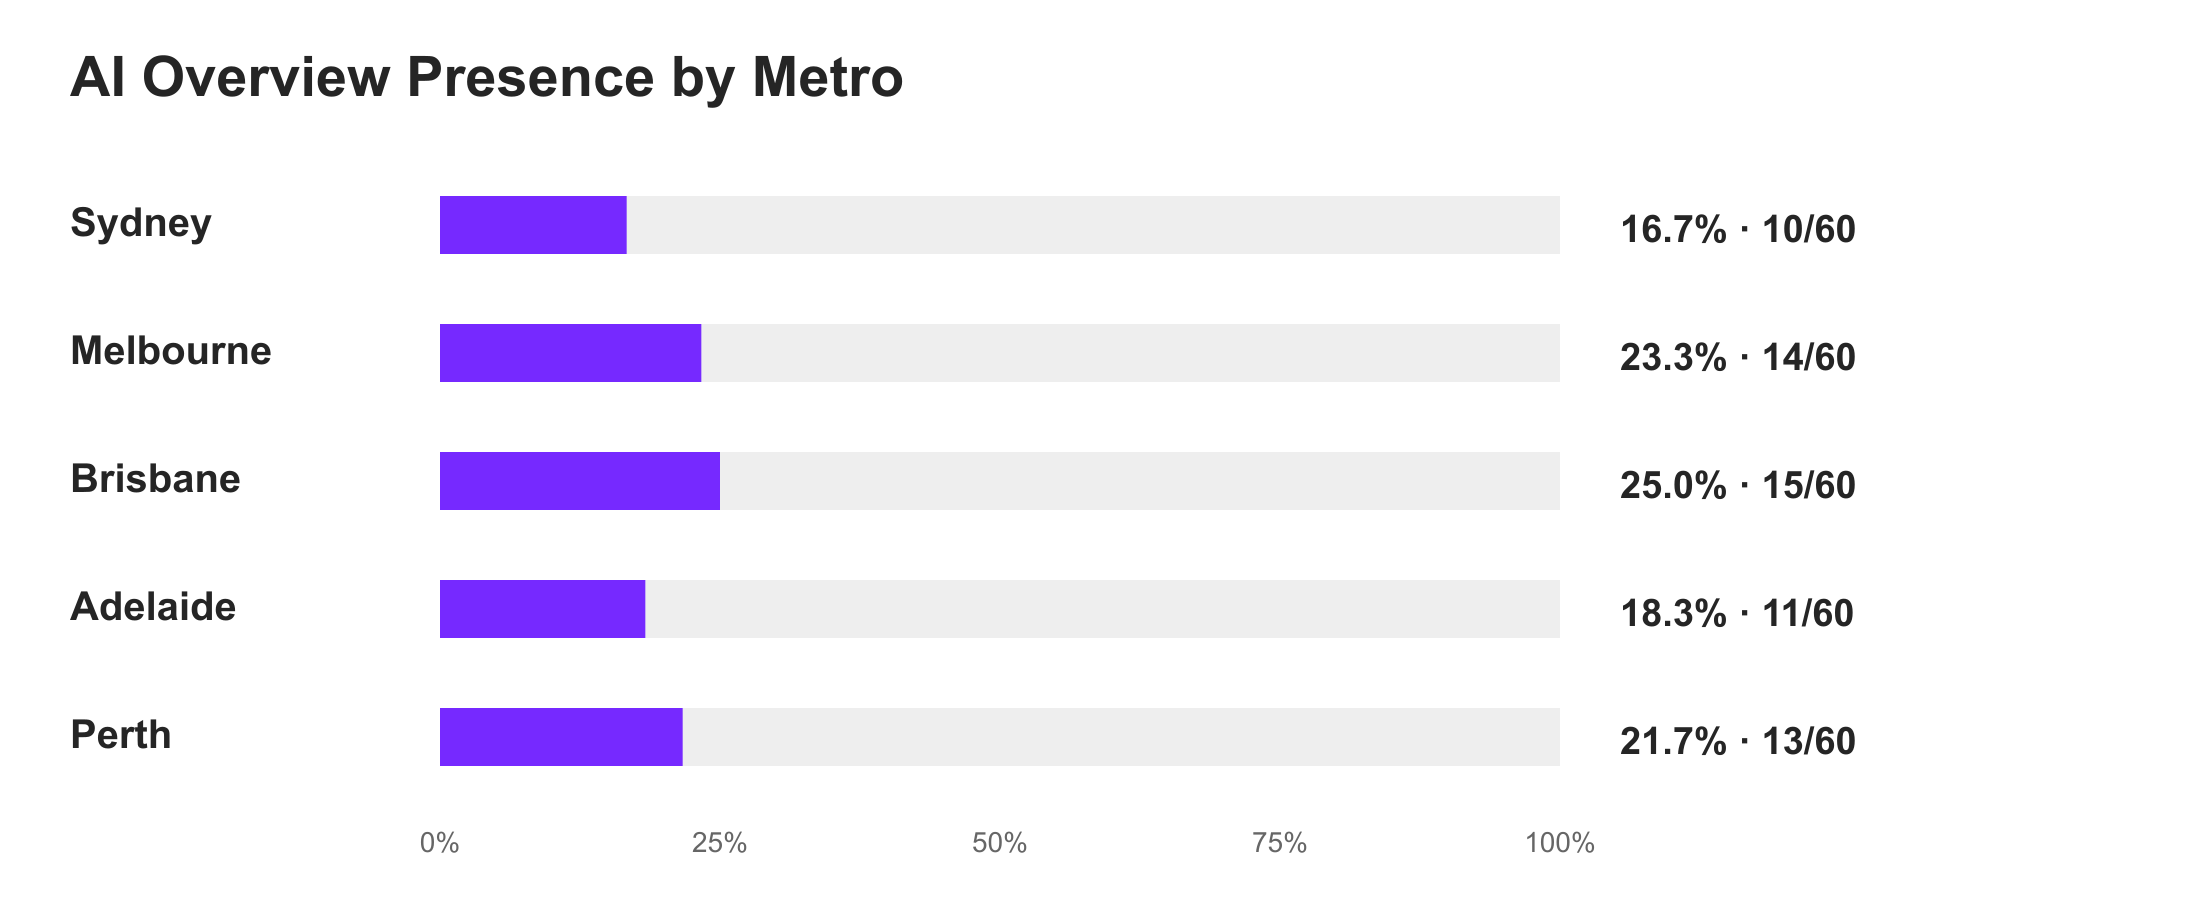
For local automotive services, map results appeared in almost every successful check, as they should. Google returned a map pack in 299 of 300 results, or 99.7%. AI Overviews appeared in 63, or 21.0%.
This part of the study covered mechanics, car servicing and car repairs across 50 locations in Sydney, Melbourne, Brisbane, Adelaide and Perth. We tried both “near me” searches and searches naming the suburb, such as “mechanic glenelg adelaide”.
| Measure | Result |
|---|---|
| AI Overview across the panel | 63/300 (21.0%) |
| AI Overview for near me forms | 37/150 (24.7%) |
| AI Overview for named suburb forms | 26/150 (17.3%) |
| Map pack across the panel | 299/300 (99.7%) |
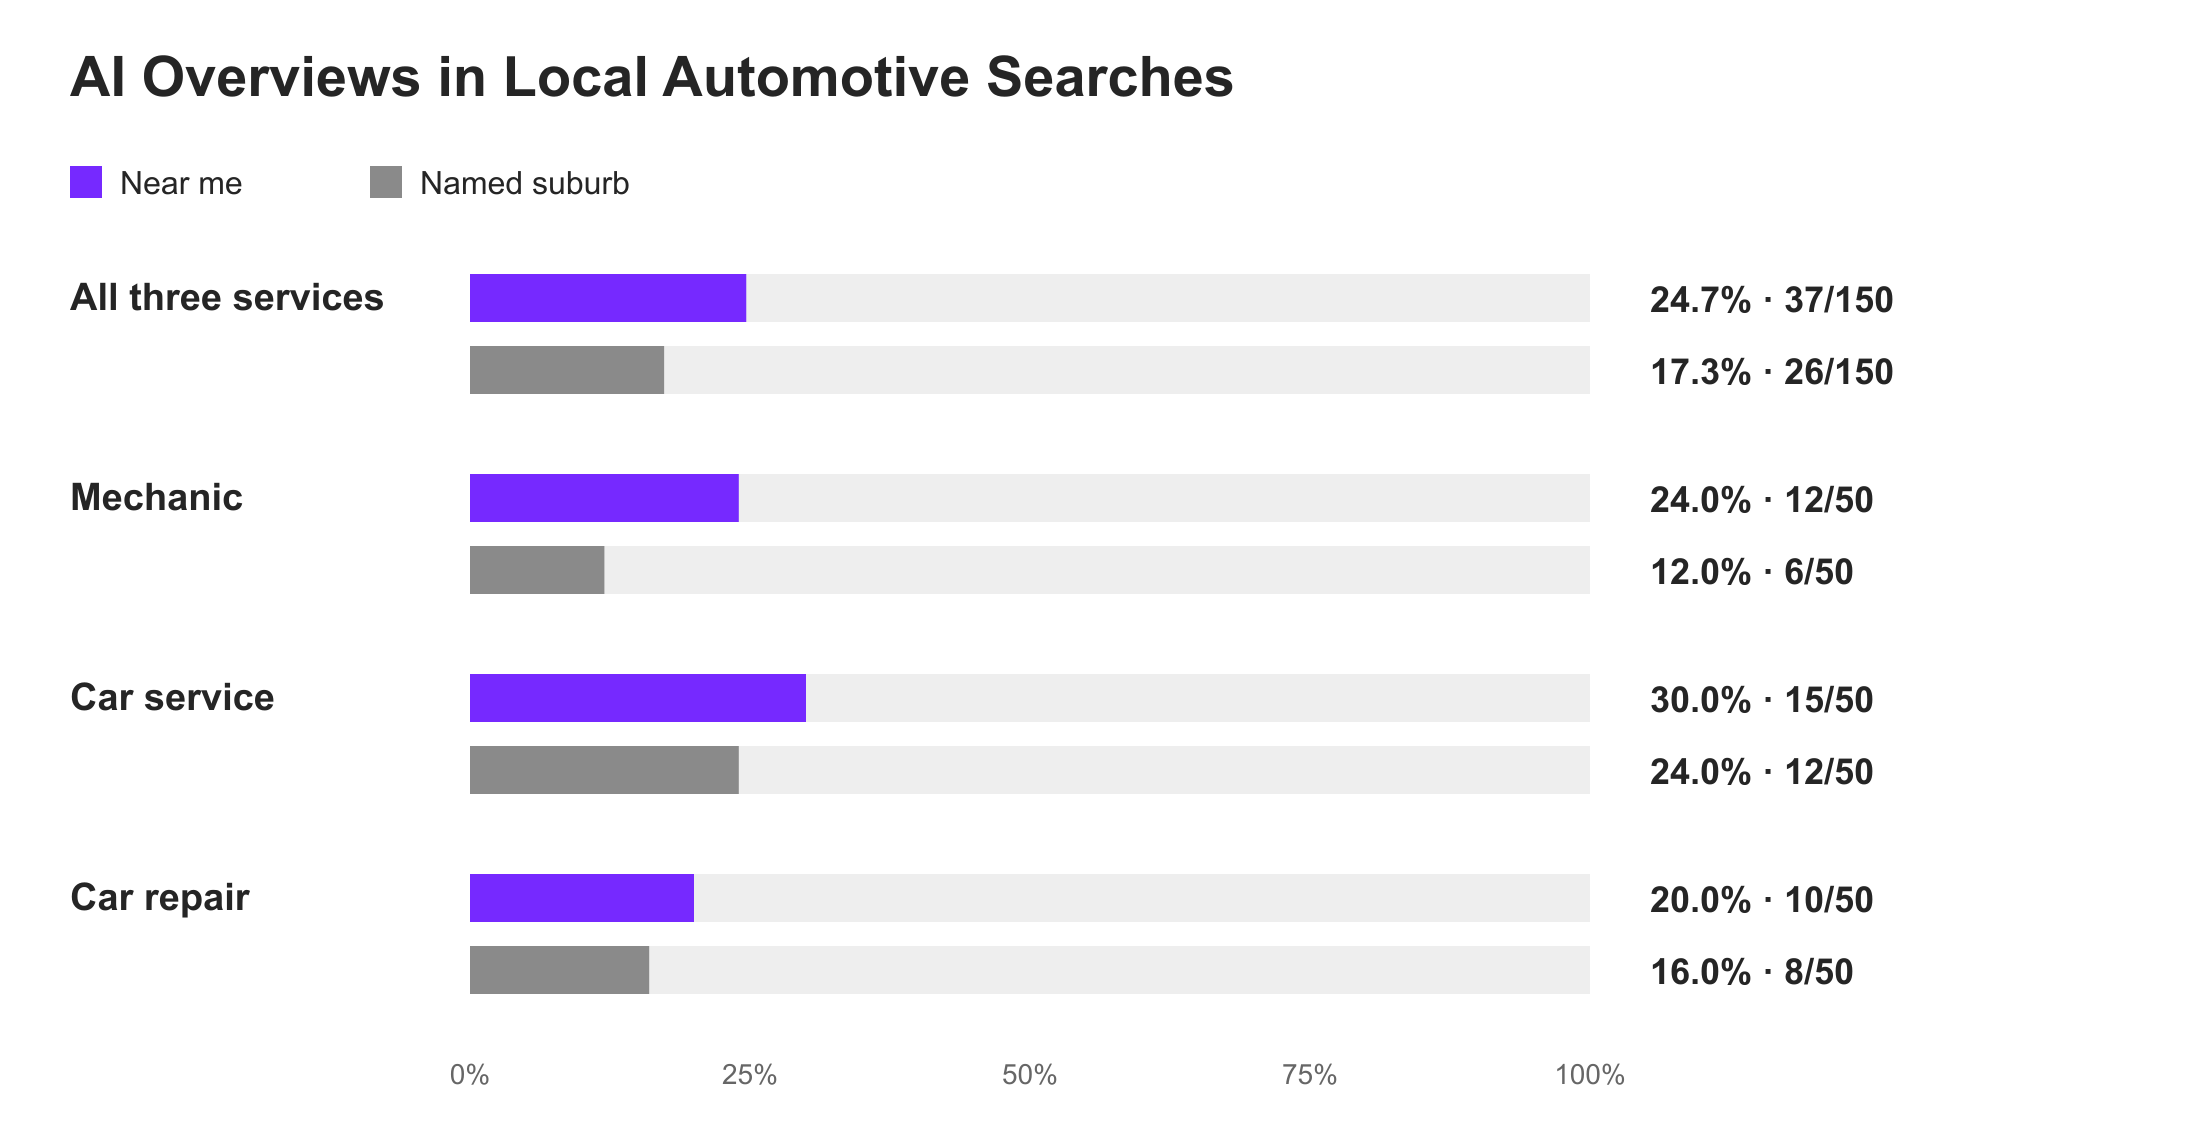
The near-me searches returned AI Overviews more often in our sample, at 24.7% versus 17.3% for named suburbs. We repeated the three near-me queries across all 50 locations, so those 150 checks represent the same searches in different places.
Map results and AI answers also appeared together. We saw 62 results with both, and 237 with a map pack and no AI Overview.
These local searches cover a different task from researching which car to buy. The 21.0% and 88.5% figures come from separate samples, so they shouldn’t be treated as a rise or fall in AI coverage.
Review Counts In Mechanic Map Results
We also looked at the review counts on the mechanic listings Google returned. The median was 114 in Brisbane and 107 in Adelaide, compared with 181.5 in Melbourne.
The median is the middle review count when the listings are put in order. With an even number of listings, we average the two middle counts. The table shows it two ways, counting every appearance in a result, then counting each identifiable business once.
We checked up to three map listings for each of ten planned mechanic searches per city. For example, Sydney’s sample was 30 listings, with a median of 125.5 reviews per listing.
Interestingly, those figures happen to match for the mechanic searches, even though some Brisbane businesses appeared more than once.
| Metro | Median per appearance | Listings counted | Median per unique business | Businesses counted |
|---|---|---|---|---|
| Sydney | 125.5 | 30 | 125.5 | 30 |
| Melbourne | 181.5 | 30 | 181.5 | 30 |
| Brisbane | 114 | 30 | 114 | 28 |
| Adelaide | 107 | 27 | 107 | 27 |
| Perth | 136.5 | 30 | 136.5 | 30 |
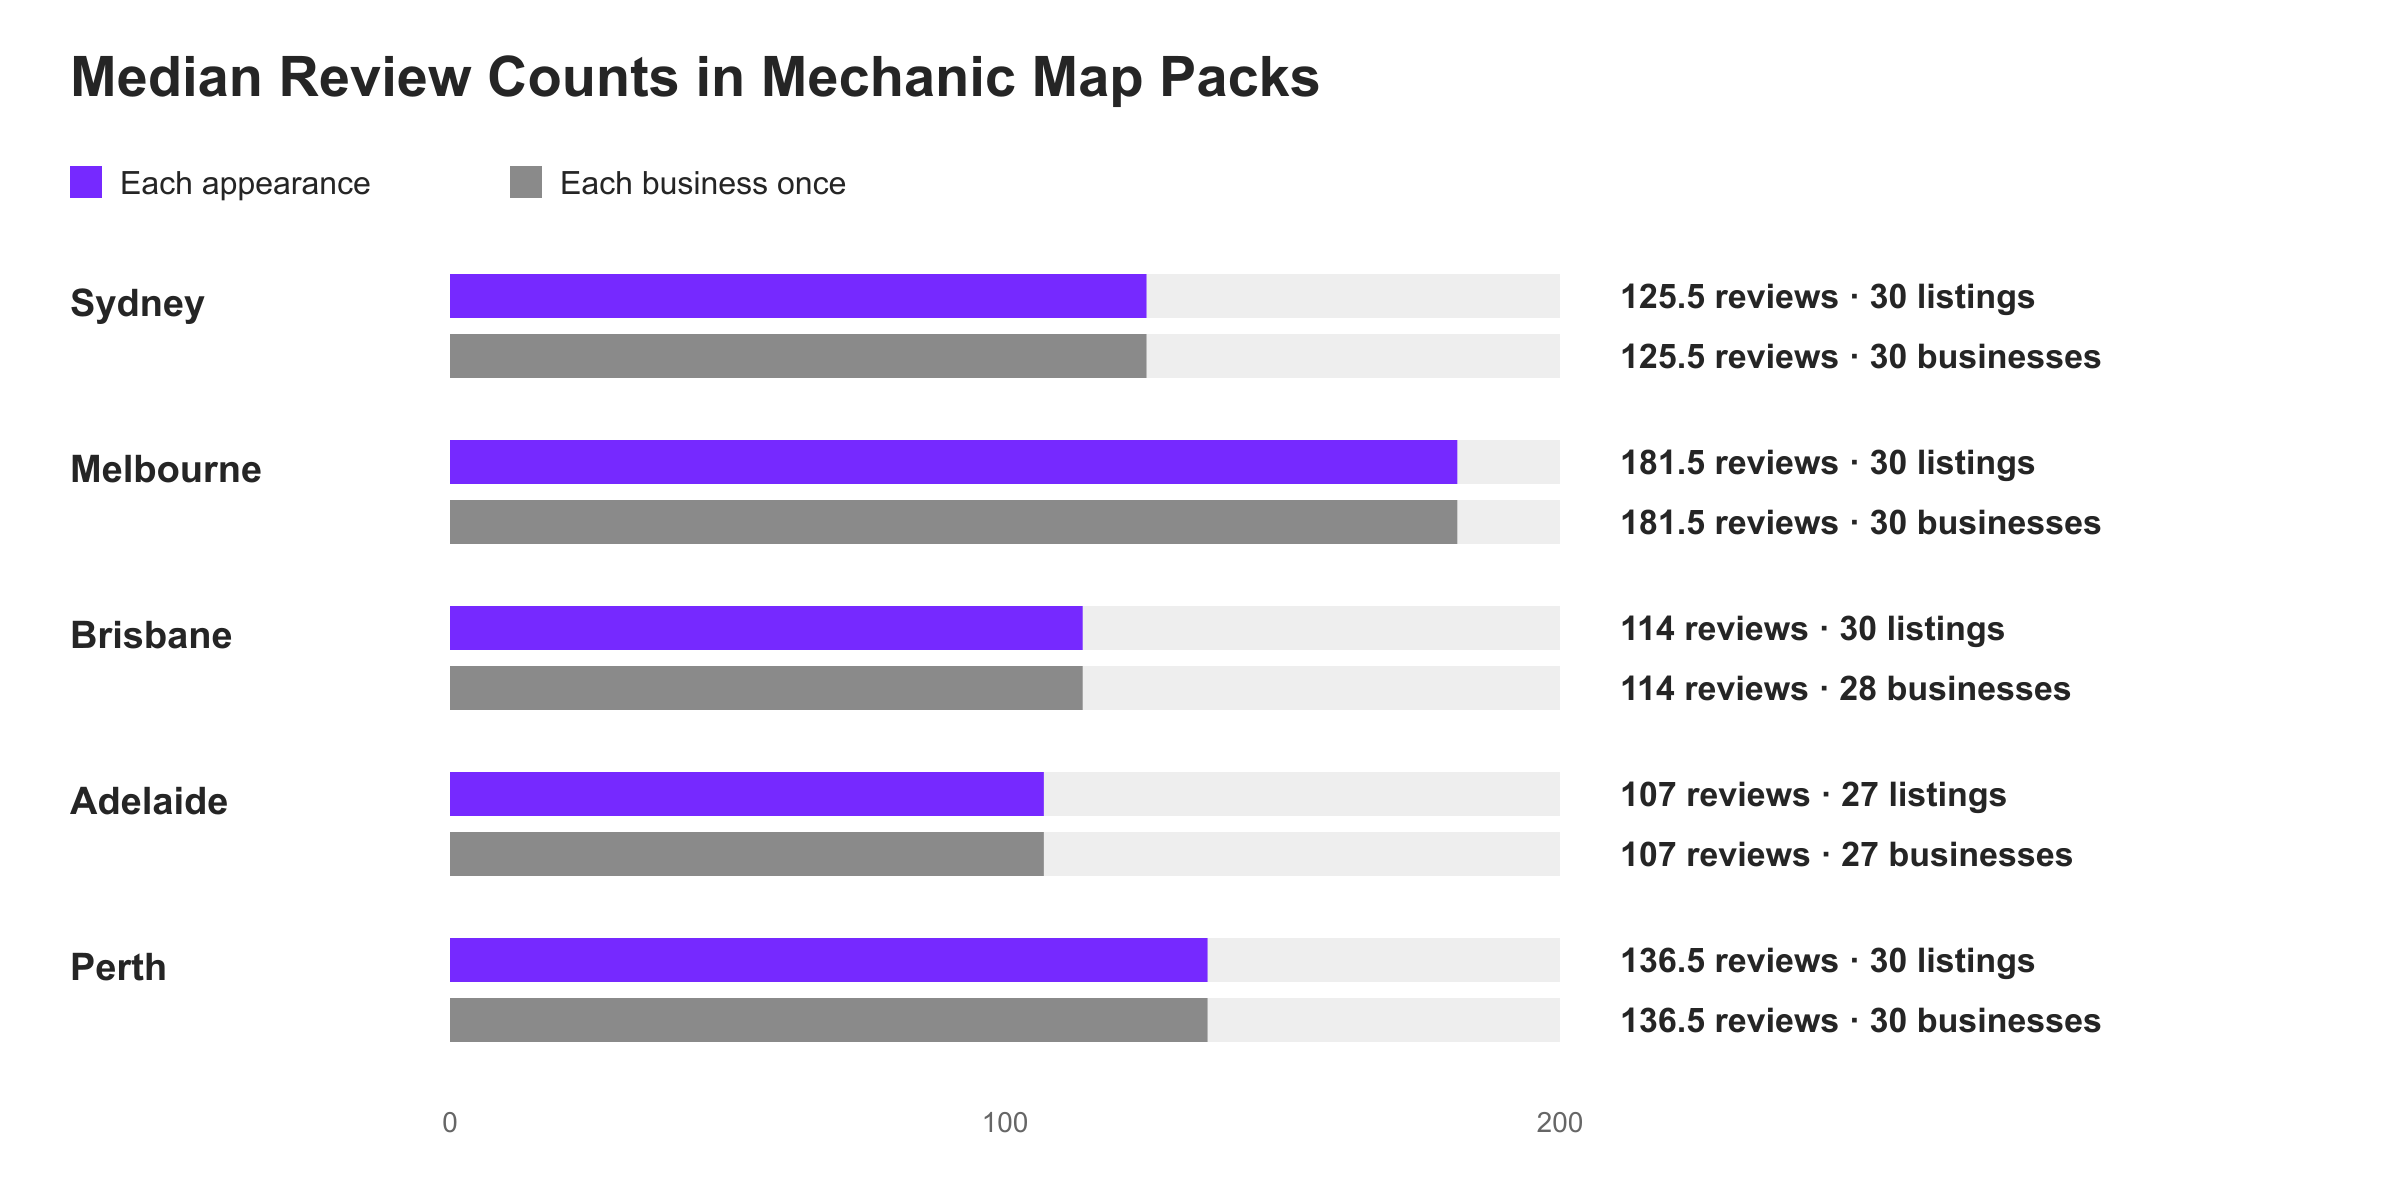
Now I wouldn’t turn this into “you need 114 reviews to rank in Brisbane”. We counted reviews on the listings that appeared; we didn’t test what caused them to rank. However, reviews are a local ranking factor, and more so a customer trust signal.
Fan out querires show that LLMs look for “best/top rated” etc, and that is where reviews play a role here. High rating and count allows businsses to be cited in those terms.
So if you run a workshop, this is a starting point for looking at the businesses you’re competing with locally in AI answers.
The review sample came from ten planned mechanic searches per city. The wider service sample and a separate check of CBD query wording are covered in the research notes.
Examples From The Local Results
For “car service near me” in Chatswood, the answer asked about the service needed, the vehicle type I had and how close the business should be.
For “car service salisbury adelaide”, it named three businesses and included their review counts and ratings, in a different order from the local list.
Then “car service bankstown sydney” returned a map pack with no detected AI Overview.
These are all materially different results. The key differentiatio here though is that “near me” implied a secondary search was needed withtin Google, whereas when I specificed a suburb, I just got answers.
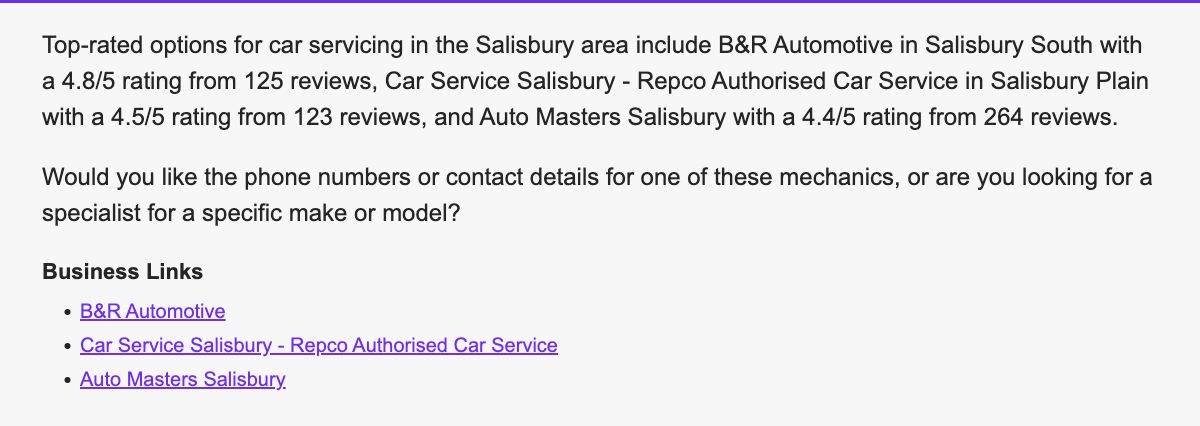
You can download the 300 local search checks, local statistics and sample notes, and review-count tables.
How AI Mode Took The Search Further
We started one AI Mode conversation with “tesla australia”, as what is a pretty stock standard search.
This is where secondary search kicks in hard though. Google’s AI Mode offered several next steps as proposed follow up prompts, including:
- finding a test drive or nearby location
- explaining Model 3 and Model Y prices and specifications
- and finding Superchargers or Powerwall installers
All of that followed a two-word brand search. And it’s in these conversations where brands can fall off as the secondary search questions may cover topics the brand does not explicitly.
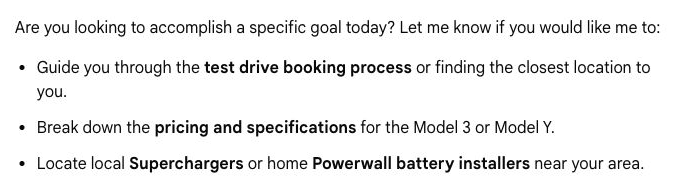
We chose pricing and asked about both models in Australia on comparable price bases. Google compared the Model 3 and Model Y, then offered an NSW drive-away estimate with stamp duty and registration for a particular grade.

We hadn’t chosen a grade, so we asked for indicative NSW drive-away prices across both ranges and told it to separate estimates from firm quotes. Within a few exchanges, “tesla australia” had become a local pricing comparison.
The “everest vs prado” conversation took a different path. Google asked about suburban family use or remote driving, towing a caravan or boat, and budget or trim preferences.
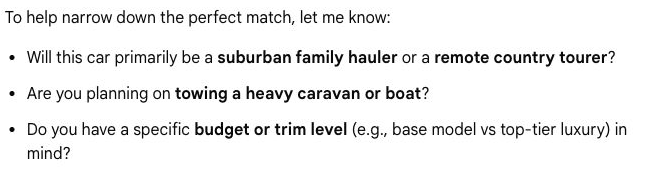
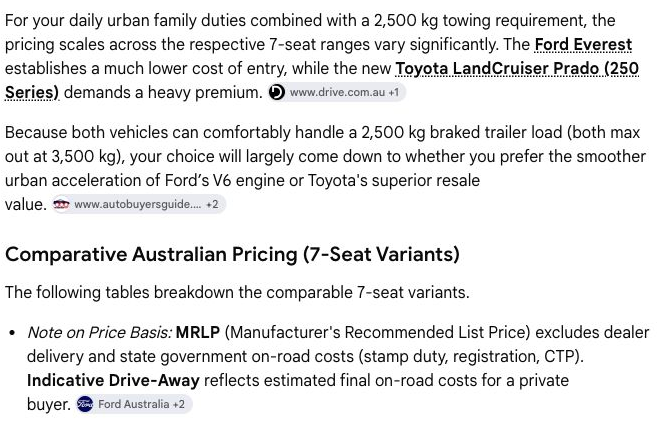
We replied with family and city use, occasional regional trips, seven seats and a 2,500 kg loaded braked trailer. We left the budget and trim open.
The next answer focused on Australian seven-seat variants. Google then asked about fabric or leather and any must-have luxury features. With those left open too, it produced a comparison of mid-to-high grades with seven seats.
We saw similar follow-ups after searching “subaru forester”. Google first asked whether we meant a new purchase or a particular year. Once we specified the current Australian range, it asked about driving, budget and towing.
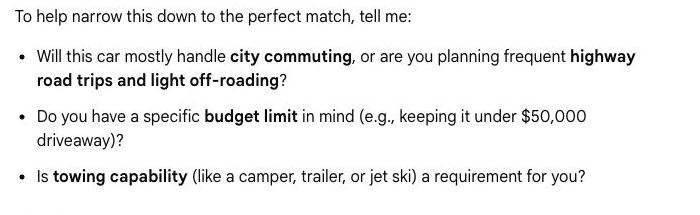
Across the opening answers in our 40 conversations, 24 asked about budget, 19 about size, space or seating, and 15 about use or driving distance. An answer could ask about more than one of these.
We supplied the replies in these conversations, but typically Google gives you 3 options, which can lead to quite different outcomes.
Intellar’s examples show how our searches developed as they may for a typical customer. This also highlights why owned content is so important for brands.
If you do not clearly cover your pricing, specs, trims, even contexualise your driving range and usage, then those conversational answers are likely to be owned by someone else.
Google can expand the search behind the scenes as well. Its documentation describes “query fan-out”, where AI Overviews and AI Mode run related searches across subtopics and sources. Not every fan-out source is presented as a citation or mention.
Which Sources Did Google Cite?
YouTube appeared in 71 of 116 AI Mode answers, compared with 34 AI Overviews for the same questions. Drive appeared in 53 AI Mode answers and 16 AI Overviews. Carsales appeared in 55 and 42 respectively.
We found those differences in Ahrefs Brand Radar, which stores AI answers and their citations. From our 509 automotive records, we could match 116 exact questions with one answer from each Google product.
Car brands’ own websites appeared regularly too. We found verified citations to official brand sites in 49 of 116 AI Mode answers (42.2%) and 46 of 116 AI Overviews (39.7%). Across both products, that’s 95 of 232 answers, or 40.9%. The sites included Toyota, Kia, Hyundai, Subaru and Mazda.
For “toyota hybrids”, both saved answers cited Toyota Australia’s hybrid range page.
I’d make your own website the starting point for automotive AI SEO. Make your Australian prices, grades, specifications and model comparisons easy to find and keep them current. A website doesn’t guarantee a citation, but Google was clearly using official brand pages as sources in this sample.
Download the official brand-site citation data.
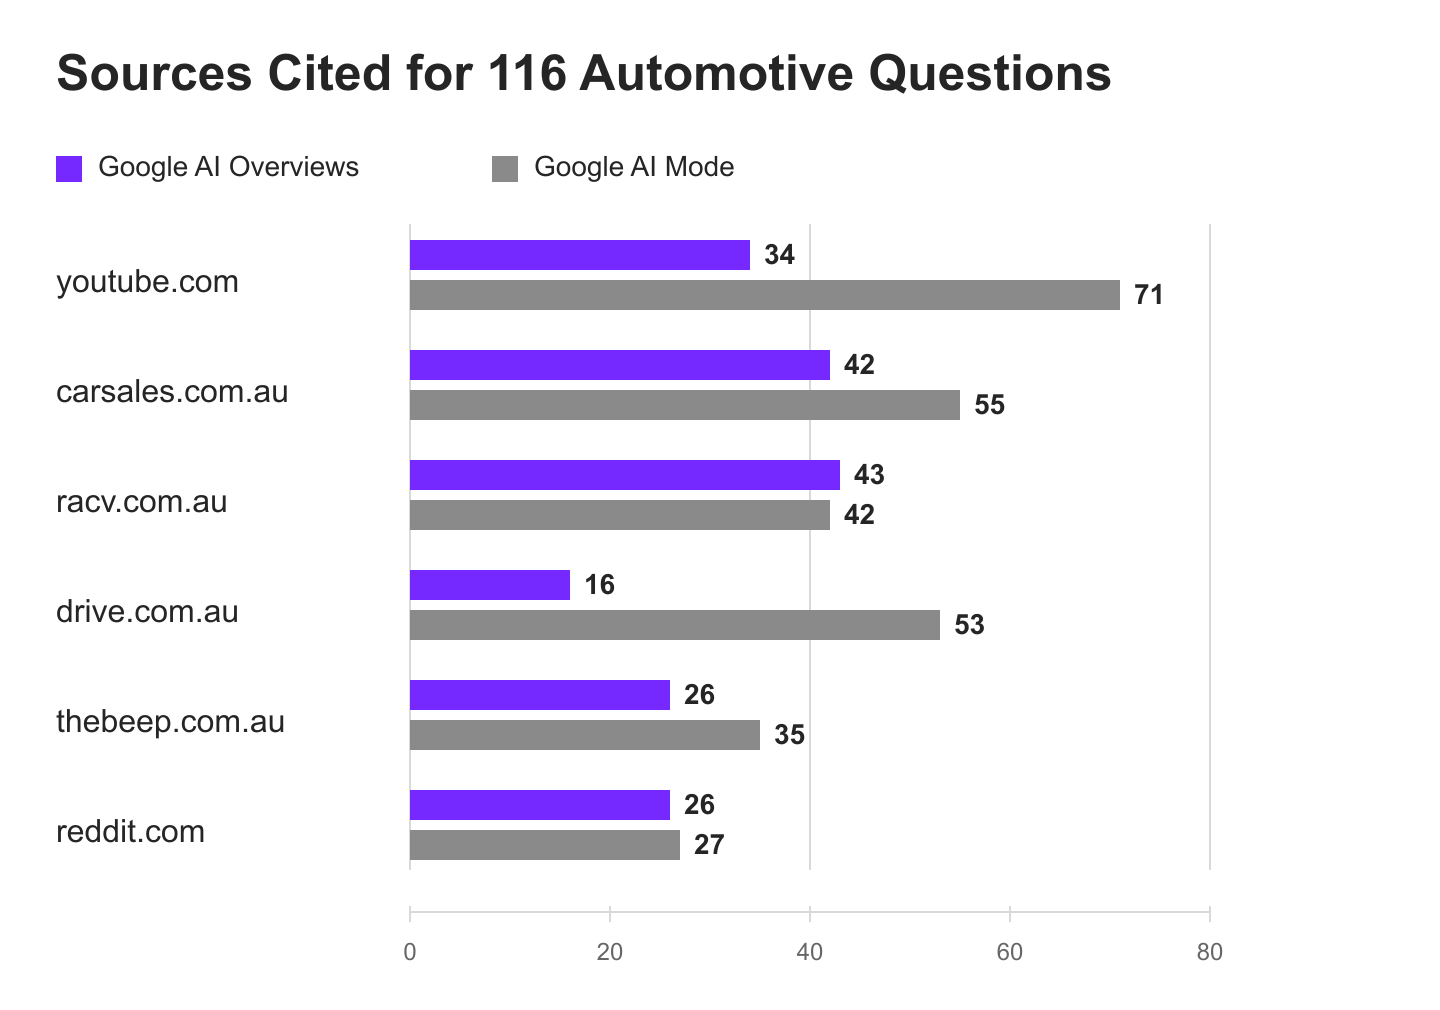
Looking at each question side by side makes the gap clearer. “AI Mode Only” below means that publisher appeared in the saved AI Mode answer but not in the AI Overview for the same question.
| Publisher | Both Answers | AI Overview Only | AI Mode Only | Neither Answer |
|---|---|---|---|---|
| YouTube | 26 | 8 | 45 | 37 |
| Drive | 12 | 4 | 41 | 59 |
An AI Overview-only report would have missed YouTube citations for 45 questions and Drive citations for 41 questions in those paired answers. Download the paired publisher counts.
I’d also include motoring reviews and videos in that work. If a walkthrough describes the wrong grade, an old price or overseas equipment, it’s worth knowing about. Your own model page is only one of the places someone can find information about the car.
Australian Searches Can Include Overseas Information
I’ve seen this one happen in practice a few times anecdotally. Even on pricing queries for cars.
One of the clearest examples in this study started with “most fuel efficient used suv under $5,000”. We used Australian search settings and a Sydney location. Google replied with miles per gallon, references to US safety organisations and a link to a British £5,000 buying guide.
The most fuel-efficient used SUVs you can typically find for under $5,000 are older, front-wheel-drive compact and subcompact crossovers that get around 24 to 28 MPG combined.
Exact excerpt from the AI Overview returned through the API in September 2026. We don’t have a browser screenshot of this answer.
The answer mentioned Kelley Blue Book, IIHS and NHTSA. Its sources included Parkers’ “The best used SUVs for under £5000 in 2026”.
We hadn’t written “Australia” or “AUD” into that query. Even so, it’s an example of google.com.au producing an answer with international assumptions.
As AI can and does aggregate from everywhere, this is how some AI results in Australian SERPs can get muddied by international answers.
This typically happens more of an OEM has a strong counterpart domain, let’s say an American website, where that website specifically has a buyer guide, or a comparison etc, and the Australian website does not. You will lose brand real estate to this information, and AI will go one further and confidently showcase datapoints as fact in Aussie SERPs.
So when you’re doing prompt research for an automotive brand, I’d check the currency, local availability and vehicle details before treating that shortlist as relevant here.
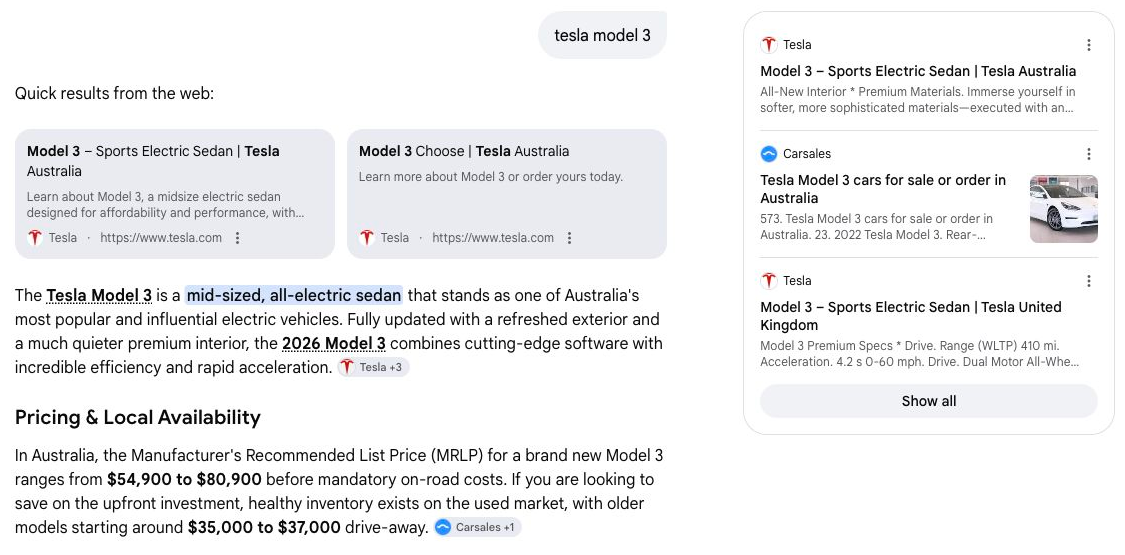
The mix was less obvious in a Tesla Model 3 answer. It gave Australian manufacturer list prices, but the source card beside a range statement linked to Tesla’s UK Model 3 page. The card said United Kingdom; the range statement didn’t name a market or test basis.
We also saw BYD Australia and BYD’s European Atto 3 page cited together in an answer that gave Australian pricing.
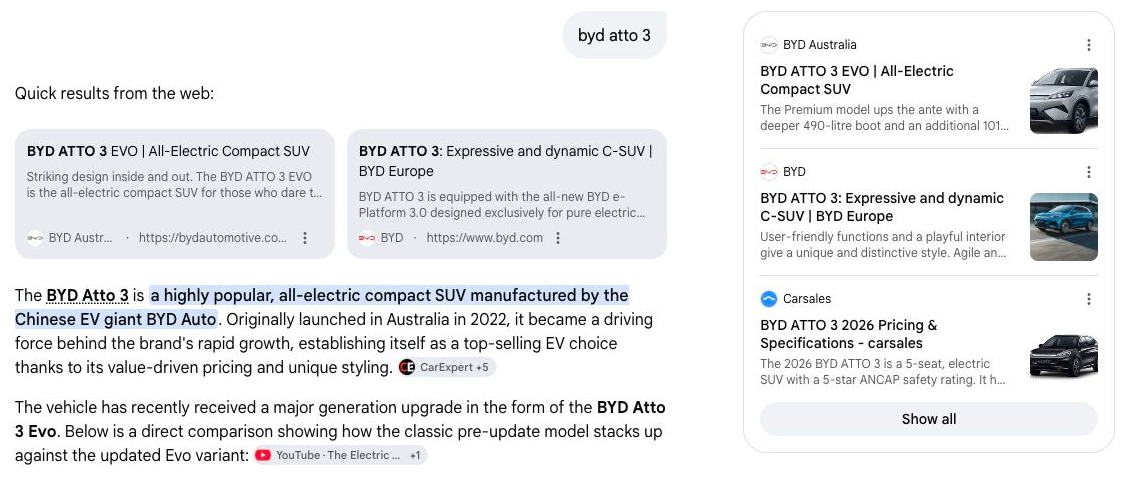
An overseas source doesn’t automatically make an answer wrong. A cabin feature, for example, may be the same in both markets. The question is whether the particular claim applies to the Australian car or not.
Trims, specs, names can all vary by market. Again, you need to uncover this detail and optimise to override it.
In Brand Radar, we found explicit overseas country or language-region markers in cited URLs for 12 of 302 AI Overview records and 22 of 207 AI Mode records. That catches obvious URL clues, but misses overseas pages without them. It isn’t a count of incorrect answers.
With that, I’d also recommend to keep the full URL in your reporting per prompt. If your Telsa in Australian, you’d want to know if many of your AI citations are tracking the US version and not the Australian.
Errors And Missing Details In The Answers
We checked several individual claims against manufacturer information and ANCAP. Four examples contained an error in a rating, grade name, drivetrain or price. Another gave a towing figure that was valid for only one powertrain.
Small details like this do matter. This is why car brands must have clearly tabled html data for their specs. If your variant level detail is buried in a PDF, bu prominent on a third party site like CarsGuide, or worse yet, an international site like Top Gear, then you will lose that citation and the answer will be wrong.
Google Gave The Kona An Extra ANCAP Star
In a Kona follow-up about family strengths and trade-offs, Google gave the current generation’s petrol, hybrid and electric variants a five-star ANCAP rating.
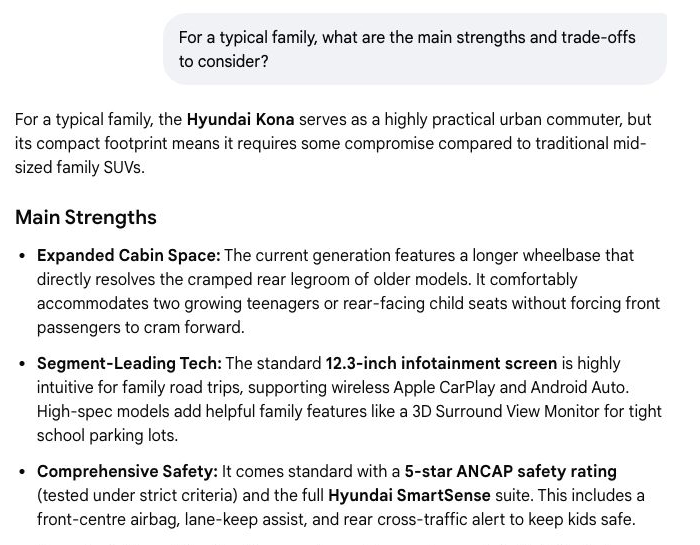
ANCAP rated that generation four stars across those powertrains. We checked the generation and variants, so this was a direct mismatch with the Australian rating.
Anyone using that answer to shortlist a family car would be comparing the Kona with the wrong safety rating.
The CX-5 Answer Included A UK Grade
An AI Mode answer for “mazda cx-5” included this pricing paragraph.
Entry pricing starts around $43,990 drive-away for base variants like the G25 Pure, scaling up depending on the grade (such as Evolve, Touring, and Exclusive-line trims).
Exact excerpt from the saved AI Mode answer.
Exclusive-Line caught our attention. Was Google just using “exclusive” loosely, or was it naming a grade from another market?
Mazda Australia’s range announcement listed Pure, Evolve, Touring, GT SP and Akera. Mazda’s UK announcement listed Exclusive-Line alongside Prime-Line, Centre-Line and Homura.
So Exclusive-Line was a named UK grade, and Google had included it in a paragraph about Australian pricing. The answer doesn’t tell us which source introduced it however…
A Towing Figure Needs Its Powertrain
The Mazda CX-90 example needed a closer look too. An AI Overview for “suv for towing”, gave the CX-90 a 2,500 kg braked towing capacity.
Mazda’s Australian tow-pack page supports that figure for the petrol CX-90. The diesel figure is 2,000 kg.
The answer didn’t specify the powertrain. We left this unresolved because 2,500 kg is correct for one version of the car.
The point is with this one, explicity towing capacity detail by variant is needed in the copy on a model or comparison page. I’d put “petrol” or “diesel” beside the number so a buyer (and bots) don’t have to guess.
A 2WD Utility Vehicle Appeared In A 4WD Answer
An AI Mode answer for “best electric 4wd australia”, described the Crossfire E5 as a “4×4 Electric UTV”. Crossfire’s own specification lists rear-wheel 2WD.
The E5 is a utility vehicle for farm and site use. Google had both included it alongside passenger cars and given it the wrong drivetrain.
There was a smaller error in a 2026 RAV4 answer too. Google swapped two digits in the GR Sport manufacturer list price, showing $66,430 where Toyota Australia listed $66,340, excluding on-road costs.
It’s a $90 difference. Much less consequential than the safety-rating example, but still the wrong number for the same vehicle and price basis.
Also now consider that Google seems to exclusively use MLP as pricing data within SERPs. This slight discrepancy can be hard to shake, particularly in LLMs, where data like is likely grounded.
So use MLP, use dynamic RDP, use MLP in your schema, make both clear in html on your page. That way you control the pricing answer.
What Automotive Brands And Publishers Can Do
So with all that said, here’s you automotive brands should do.
Work backwards. I’d start with the models and services that bring in business. Run the searches your customers would use, read the AI answers, then check the details against your Australian pages.
Prices, grades, safety ratings, towing limits and local availability all came up in this research. They’re also details that can decide whether a car stays on someone’s shortlist. Make the model year, variant and market clear wherever the answer depends on them.
You can make all that clear on your website. You need BLUF statements on model pages, clear pricing, schema, important information in static html. The same goes for automotive services. Give LLMs answers it can hang it’s hat on.
Don’t say: “servicng ranges from X to Y”. Say servicing starts at $X, with a typical cost across our customers in 2026 being $X. Google & LLMs love data like this.
Give the broader searches proper attention too. A hybrid range page, a budget shortlist and a model comparison serve different needs.
All of these things you may already being losing brand real estate on in organic search.
With a budget guide, for example, tell people whether the price includes on-road costs. A car below $50,000 before those costs may be outside a $50,000 drive-away budget.
For comparisons, use the follow-up questions to find gaps. Our Everest and Prado conversation ended up needing seven seats and capacity for a 2,500 kg trailer. Can someone get to the relevant grades from your comparison page, or do they have to open several brochures and piece it together?
Check older pages as well. An old review can still help someone buying used, provided the year and version are obvious. Link it to the current model where that helps, and explain what’s changed.
Then look beyond your own site. Include the reviews, dealer pages and video walkthroughs that appear in the answers. Record the actual URL and check which market, year and grade it covers. The UK Tesla link would have disappeared in a report that only counted brand or domain mentions.
For a workshop, I’d include local SEO in the same review. Keep an eye on the business details, service descriptions and review information that Google returns, along with whether an AI answer recommends the business or simply explains the service.
Save a small set of answers each month, with the query, date and links. Keep the surrounding results in your screenshots so you can see where the AI Overview appeared. That gives you something concrete to compare next time, alongside rankings, traffic, enquiries and bookings.
This is work I’d include in an automotive SEO program. Help someone find the right car or service, answer the next question properly, and make the Australian details easy to check.
This is the level of granularity Intellar understands as a specialist automotive SEO business.
About The Research
We used separate datasets for vehicle searches, AI Mode conversations, Brand Radar and local services. The dates, sample sizes and collection methods are set out below so you can see what each finding covers.
Vehicle Search Method
We collected the 400 searches through SerpAPI on 28 September 2026, using Australian country settings, English, desktop and a requested Sydney location. All 400 returned a result we could classify, with 354 AI Overviews and 46 absences.
The list had 80 queries in each of five groups and was fixed before collection. Each query belonged to one group. For example, “subaru forester vs rav4” was counted as a comparison, while “subaru forester price australia” was a model search. The sample was deliberately selected and wasn’t weighted by search volume.
We counted AI Overviews at any position. We didn’t classify their page position across the full sample, measure clicks or fact-check all 400 answers. This is a record of what those searches returned on the collection date, not an estimate for every Australian automotive search or a measure of Google’s error rate.
AI Mode Conversation Method
The 40 AI Mode conversations were collected in Septmeber 2026. We chose the starting searches and supplied the replies, so these are research conversations rather than observed customer journeys.
We recorded the visible answers and links. We couldn’t see Google’s background searches. Follow-up categories can overlap, because one opening answer could ask about budget, seating and use together. The screenshots are cropped excerpts of retained captures.
Brand Radar Method
The Brand Radar selection contained 509 Google records after six irrelevant records were removed, split into 302 AI Overviews and 207 AI Mode records. One AI Mode record had no answer text. Of the 509 records, 400 were dated August or September 2026.
We matched 116 exact questions with one answer from each product. Seven other shared questions had ambiguous matches and were excluded. Each publisher domain counts once per answer, even if linked more than once. We didn’t assign a publisher where the destination couldn’t be resolved.
The saved answers have different dates. The comparison therefore shows which publishers appeared in those records; it doesn’t isolate the effect of the Google product, establish which source produced a claim, or measure referral traffic. Read the Brand Radar selection notes.
For the official brand-site figures, we counted each answer once if it cited at least one verified official vehicle-brand website, including national brand/importer sites and overseas brand sites. Dealers, publishers, marketplaces and social platforms were excluded. Some citation destinations could not be identified, so these are minimum observed rates. This measures citations to any official car-brand site, not whether a particular brand’s own site caused it to be recommended.
Factual Checks
We checked individual claims from browser captures and saved Brand Radar answers against primary sources, with a separate review of each proposed error. Where the market, year or variant couldn’t be matched confidently, we kept the claim unresolved. Overseas citations alone weren’t counted as errors.
These examples don’t establish an overall error rate. We didn’t collect ChatGPT answers, repeat the full study over time, or measure what people bought.
Local Search Method
We completed 300 local search checks through SerpAPI in September 2026. We requested Google.com.au, Australian country settings, English, desktop and a supported suburb location. No personal Google account was used for the API collection. An API request is not an incognito browser session.
The test used 50 selected locations, ten in each of five metros. At each location we searched for mechanic, car service and car repair, using both a near-me form and a named suburb-and-city form. That gave us 153 distinct query strings, since the same three near-me searches were repeated across all 50 locations.
Locations and queries were fixed before collection. Each city had 60 planned checks and each query form had 150. We ran matching forms consecutively at the same requested location, with their order randomised using a fixed seed. Two initial technical failures were completed later in September. Their matching near-me searches were not rerun, so those two pairs were collected at different times.
All 300 planned checks now have assessable results. We counted AI Overviews and map packs separately. The original failed attempts remain archived and were not counted as absent features.
The locations were selected for geographic spread and provider support. They aren’t representative of all Australian searches, and this part of the study doesn’t cover New Zealand. These results also can’t be compared with the vehicle-search sample as a time trend. We measured returned features, not their placement, accuracy, clicks or conversions.
For reviews, we took up to three map listings from each named-suburb result, excluding those marked as ads. The first median counts every listing appearance. The second counts each identifiable business once per city and service group, using its first recorded review count. Separate branches with different business IDs stay separate. Missing counts remain missing, and calculations use numeric counts rather than rounded displays such as “2.1K”.
For mechanic searches, Sydney, Melbourne, Brisbane and Perth each returned ten map packs from ten successful searches. Adelaide had ten successful searches but nine map packs. This explains the different listing counts in the mechanic table.
The provider doesn’t explicitly label every unmarked listing as non-sponsored. We also checked archived cards for visible sponsorship labels and ad links; those additional checks are included in the downloadable review tables. Provider response transcriptions and archived-page renders are labelled separately from native Google screenshots.
Broader Automotive Service Results
We also calculated review medians across all three services together, using 30 planned named-suburb searches per metro. This wider sample can include tyre shops, body-repair businesses and other specialists as well as mechanics.
| Metro | Median per appearance | Listings counted | Median per unique business | Businesses counted |
|---|---|---|---|---|
| Sydney | 156.5 | 90 | 156.5 | 44 |
| Melbourne | 188 | 90 | 184 | 45 |
| Brisbane | 114 | 90 | 120 | 43 |
| Adelaide | 125 | 87 | 105.5 | 46 |
| Perth | 153 | 90 | 158 | 52 |
All named-suburb checks were completed. Adelaide had one successful result without an ordinary map pack. Businesses could appear across different searches, which is why the median can change when each business is counted once.
Natural CBD Wording Check
Our original query template repeated the city name in six CBD searches, producing wording such as “mechanic adelaide adelaide”. We kept those results in the original dataset and separately tested all six natural versions, such as “mechanic adelaide”, at the same requested locations.
Replacing all six together left the named-location AI Overview rate at 26/150 (17.3%) and the map-pack rate at 149/150 (99.3%). The mechanic review medians changed in Perth but stayed the same in Adelaide.
| Metro | Primary, per appearance | Natural CBD, per appearance | Primary, per business | Natural CBD, per business |
|---|---|---|---|---|
| Adelaide | 107 (27 listings) | 107 (27 listings) | 107 (27 businesses) | 107 (27 businesses) |
| Perth | 136.5 (30 listings) | 158 (30 listings) | 136.5 (30 businesses) | 158 (30 businesses) |
The table covers mechanic searches; the feature rates cover all three services. The six replacement queries were fixed before their collection, but ran later than the originals. The differences could therefore reflect timing as well as wording. The main statistics and charts use the completed 300-check panel, with the original CBD wording.
See the six original and replacement queries, the rate comparisons, and the review comparisons.