If you’re wanting to learn how to do keyword research for SEO, then this guide will cover everything you need to know!
From research & ideation, to data collation & formatting a final report.
Here is what you will learn in a nutshell:
- How to find, research and discover keywords
- How to choose the right types of keywords
- How to use a range of keyword tools
- How to collate all the data
- How to make all the data presentable
Quick links to blog content
Research & Data Pulls
The first step of any keyword research task is to compile data dumps of relevant topics matching your business niche.
This is typically a very easy thing to do, however, this process can go quite granular, and filtering keyword data is where thing become tedious.
A full, unfiltered export is likely to not give you much much insight at all.
I’ve seen many keyword research documents throughout my years in SEO and sadly most seem to be just that, a giant data dump with no real insight.
That said, research and pulling data is the starting point, so here is how I do it.
Paid SEO Tools
To kick this off, let’s talk bout the paid SEO tools for keyword research.
While much can be done with free versions or manual research, the tools available on the market are incredibly powerful.
Having a subscription to market leading SEO tools really helps you drill into data sets and pull out quality results quickly.
SEMRush
I use SEMRush, so for the purpose of this guide, I’ll reference that platform.
For those that use ahrefs, the process is much the same.
Plugging a website into SEMrush is a great place to start as SEMrush shows you the exact keywords that a website already ranks for. It also includes historical data and comparative keyword metrics against competitors.
This is my go to tool as it takes much of the guess work out from the get go.
You can even drill down by folder path, enabling you to see every single keyword (along with SERP features) that you or a competitors URL ranks for.
This is particularly helpful when you want concise keyword sets of subtopics from domains that may cover a whole range of niches.
Department stores for example, we can include all URLs within the “Toys” category only:
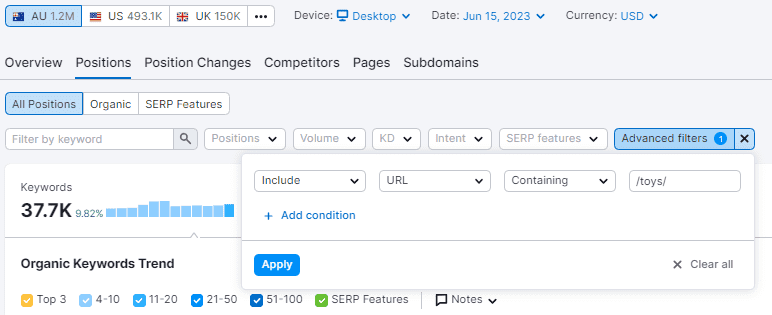
From here you can export all keywords with search volume, SERP features, competition levels, CPC’s and even the associated ranking URL.
This can then be split out by country and you can use the advanced filters to do things like:
- remove branded queries
- add/remove specific URLs
- add/remove specific keywords
- include keywords that drive a certain amount of estimated traffic.
All this will help you go granular into sub-topic keyword sets and uncover some gold.
There is a heap of information here that is useful for much more than just SEO too.
This process will give you a top-level understanding of where the volume and ranking opportunity is for non-branded topics.
This type of data can inform the products you stock, push harder on ads or get competitive with price on.
As you can see below, with a few basic filters I can already see at a glance what the top, non-branded traffic driving keywords are for this website in the toys category:
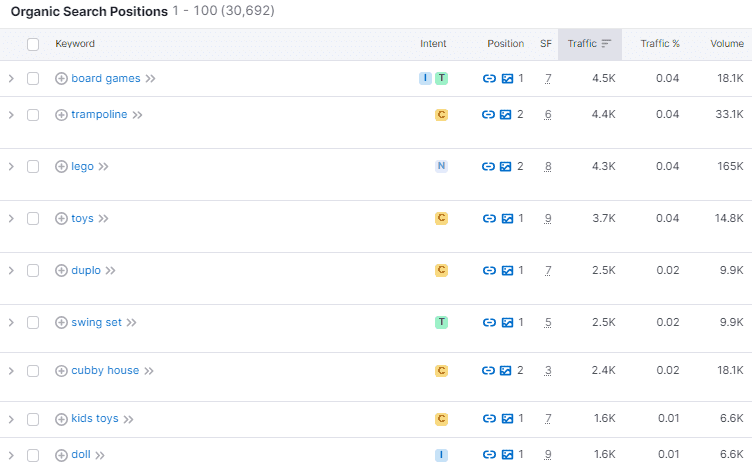
This kind of information is invaluable.
Outside of direct research on a domain, SEMrush also has a “Topic Research” function that can be used to discover content ideas, additional keywords, questions and headlines that competitors are using.
Run your keywords and topics through here to uncover even more data.
Answer the Public
Answer the Public combines Google’s Autosuggest with a question scraper.
This makes it the ideal tool for learning what questions your target audience is asking about a topic. It is the best tool out there (in my opinion) for generating quick lists of informational queries.
Set your country, type in a top-level keyword and then you’ll be given a hefty list of:
- Questions
- Prepositions
- Comparisons
- Alphabetical matches
However, in this list we are mainly concerned with the list of questions and prepositions, as those are the keywords that trigger SERP features and are often (surprisingly so) ignored by competing brands.
These informational queries are generally low in volume but also low in competition.
And as a topical set, you can create a sizeable keyword list with a decent search total search volume.
Once the data for your keyword has loaded, you will see a wheel of questions, and also a “data” tab that splits out different words, like below:
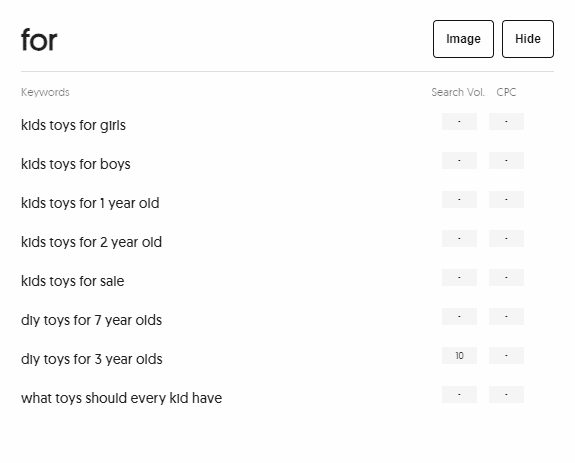
Ok now we have our list, the next steps are to:
- Export the CSV file and filter all “questions” and “prepositions” keywords so those are the only types that remain
- Delete any keywords that are not relevant or malformed
- Run these keywords through SEMRush
- Export all terms and the associated data points
Alsoasked
AlsoAsked works in a very similar way to Answer the Public.
The main difference here however, is that AlsoAsked only pulls Google’s “People Also Ask” results.
This tool goes one step further though.
When you input your keyword, AlsoAsked returns multiple levels of results, giving you a quick insight into many sub topic variations! Here’s an example:
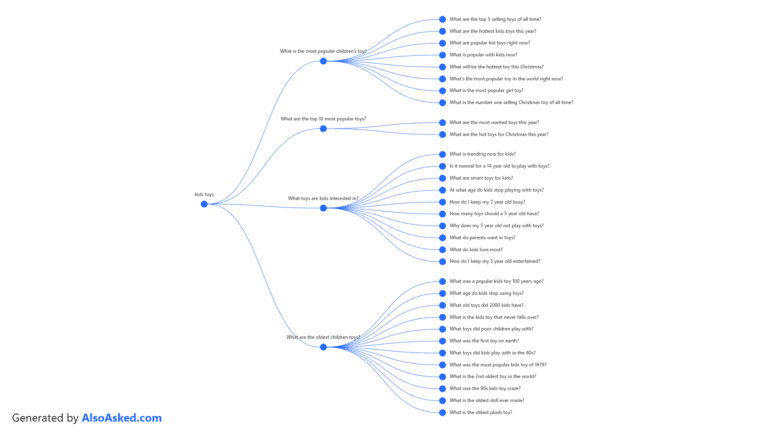
The great thing about how AlsoAsked segments keyword data is that it’s basically formatted in a done for you topical hierarchy.
“What are the top 5 selling toys of all time” is a great place to start with SEO led content.
The other 7 terms here in this cluster could all make for great content pieces too.
If I created good content around those 8 sub topics, it won’t be long before I start ranking for the higher level “what is the most popular children’s toy?”.
Frase
Frase is an AI content tool, which is awesome by the way…
But you can also use Frase for keyword research. Here’s how.
Within Frase, you can create content briefs against a keyword or set of keywords.
With this prompt, Frase will automically compile data from the top ranking results in Google. Some things include:
- Header count and wording
- Total word counts
- Statistics mentioned
- Common topics
- People also asked results
All of these things can give you unique insight into topical relevance as a whole.
Common topics are amazing starting points for content prompts.
Common topics can also be used as keywords, as this shows what the top ranking results are talking to.
Thruuu
“thruuu is an end-to-end SEO platform that empowers your content team to decipher the Google algorithm, build better content, and achieve greater organic search results.”
And it is my go to content briefing tool.
In similar fashion to Frase, Thruuu scrapes the web and aggregates search results based on your target query.
Why is this good for keyword research?
You get a very quick and concise breakdown of competitor header tags, which tells you a lot about their keyword targeting strategy. Here’s an example:
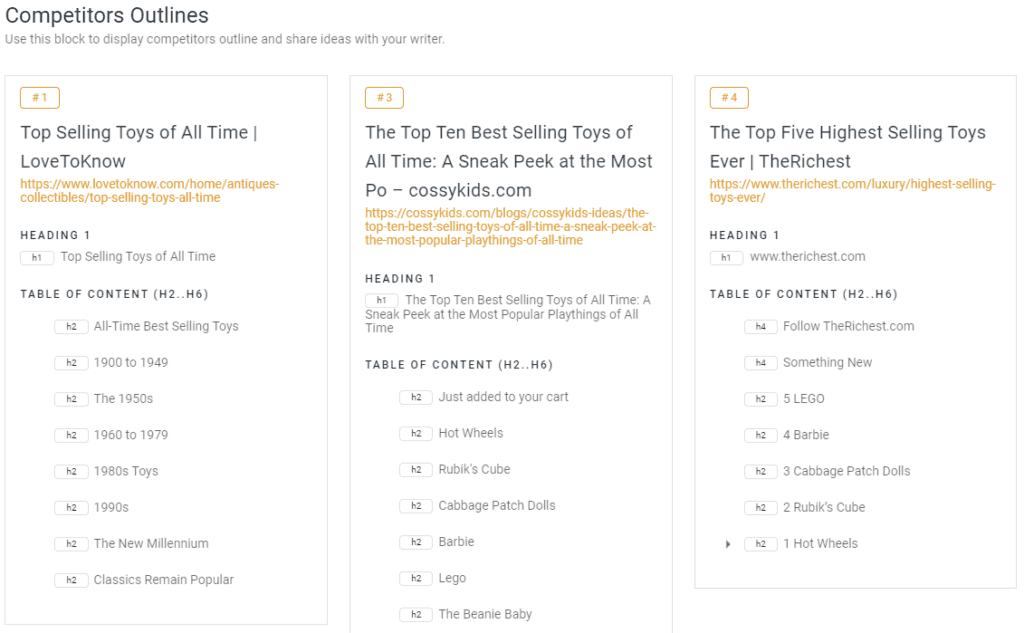
As you can see, that’s a solid list of H2s, outlined for you right there.
You’ll notice 2 distinct differences in the H2s.
The #1 result sorts everything by time period.
The other results list the toys only. Combining by of these will give you highly relevant keyword targets for your content.
Google Tools
Google Keyword Planner
The Google Keyword Planner is one the most reliable sources of keyword data online, as it comes directly from Google.
There are two key aspects when it comes to using the Google Keyword Planner for keyword research.
This tool makes it very easy to export a bulk list of keywords that you input, complete with historical metrics, or discover new keywords with their keywords ideas tool.
I almost always use the Keyword Planner to pull the historical metric data for a list keywords I’ve uploaded, such as my Answer the Public list.
So, first things first, to get the search volume for your Answer the Public list, do the following:
- Click on “Get search volume and forecasts”
- Paste in your list of informational keywords and click “GET STARTED”
- Click on “Historical Metrics” and then export the data from Google Keyword Planner in a CSV file
Secondly, if you want an additional start point for some extra research, then click on the “Find new keywords” tab and past in your core keyword(s).
You will get a list of related terms as well as complete historical volume metrics, which is very handy! That is how I use Google Keyword Planner for keyword research.
Google Search Console
One of the often underutilized tools for keyword research is Google Search Console (GSC).This is because it shows direct click and impression data from searches in Google.
A great feature is its ability to show what queries are leading to your website being displayed in the search results. To access this data, navigate to the ‘Performance’ tab, and you’ll see a list of queries.
A practical approach to uncover potential keyword opportunities is by filtering these queries based on high impressions and low clicks.
High impressions indicate that your site frequently appears for a particular query, but low clicks suggest that you don’t rank high enough, or users aren’t finding your listing attractive or relevant enough to click through on.
By identifying these high impression and low click queries, you’ve essentially found keywords that your website is already being associated with, but not effectively optimized for.
For instance, if a query with high impressions and low clicks is related to a service you offer, it may be worth revisiting the corresponding page on your site.
Look at ways to better optimise the page for this query, such as:
- Improving the metadata to better match the user’s intent
- Including the keyword more prominently within the content
- Creating new pages with supplementary content to target these terms directly
Furthermore, you could also compare your site’s listing with those of competitors who are getting more clicks for the same query. Analyze what they are doing differently and how you can tweak your listing to improve its click-through rate.
Google Search Console, when used in this manner, can be a powerful tool to improve your SEO strategy. It helps identify the gaps in your current keyword optimisation, providing a clear direction on where to focus your optimization efforts.
Google Assisant
Manual Research & Brainstorming
Google and Youtube Auto Suggest
Aside from the dedicated keyword research tools, sometimes the old fashioned method of manual searching can be a great way to discover topics, keywords and questions that your target audience has already shown interest in.
The auto suggest feature of both Google and YouTube is a great place to start.


Both of the above examples work the same way, where Google and YouTube are showing you related keywords that users have searched for.
This can be a quick and easy way to find relevant terms to a core topic that might otherwise be missed when using tools like SEMrush, Answer the Public and the Google Keyword Planner.
Finding keywords on websites like Reddit, Quora, or any other popular online forum is another great way to find topic ideas. Using Reddit as an example:
- Enter any broad topic that your audience may be interested in and then choose a popular subreddit on that topic

- Browse through all the current popular threads and just keep and eye out for any posts that may prompt addition questions and keyword ideas. You can also search within the subreddit itself.
This thread below might make you think of topics and questions such as:
- What’s the cheapest way to buy Bitcoin?
- What are the buying fees on Binance?
- Can I buy crypto with a credit card?
I find both Reddit and Quora great platforms to do this kind of research on.
Quora
Amazon and eBay
Formatting the Data
Now that we have our data dumps, we need to clean and format everything.
This is not only to remove irrelevant or no volume keywords, but to also create a presentable document that clients can easily understand and interact with.
The latter point is very important as this provides something of value to a client. It’s a resource they can continuously reference and easily navigate. This makes internal sharing on their end much easier.
Trimming the Dead Weight
The first step in formatting is to get rid of all useless keywords.
To begin, paste in all your exported keywords and create a filter. We want to filter volumes containing the following:
- 0
- (blanks)

Delete all of these terms with 0 or blank volume.
Next, create a new column to filter keywords by topic or question type and apply a “Group” to every keyword.

Apply the group tag to all keywords.
From the small sample size above, you can see how granular you could go here. In that set alone you could group by:
- brand
- location
- product type
Creating and Formatting Tables
Now that all the keywords have been assigned a group, highlight all the data on columns A, B and C, then create a pivot table in a new worksheet.
If you’re not sure how to create a pivot table, here is how to do it:
- Ensure all data is highlighted
- Click on “Insert” in the top navigation bar
- On the upper left hand side, click on “Pivot table”, then click “OK”

The new spreadsheet will open. We now need to sort the data into segments. In the “PivotTable Fields”, do the following:
- Drag “Group” to “Rows”
- Drag “Keyword to “Rows” below “Group”
- Drag “Volume” to “Values”

The next step is to insert a slicer.
Here are the steps to do so:
- Click on the pivot table
- Click on “Insert” in the top navigation and select “Slicer”
- Select “Group” in the pop-up
- Click on the volume of the first keyword (most likely cell B5)
- Click on “Data” in the top navigation and then press Z -> A

There is one last bit of formatting that needs to be done for the pivot and slicer. Here’s what you need to do:
- Right click on the pivot table and go to “PivotTable Options”
- Click on the “Layout” tab
- Un-tick “Autofit column widths on update”. This prevents the size of the pivot table changing
- Right click on the slicer and go to “Size and Properties”
- Click on the “Position Layout” tab dropdown
- Change the number of columns to suit how many keyword groups you have
- Turn off gridlines. Under “View”, untick “Gridlines”
- Rename the pivot table and slicer headers. “Keyword” and “Volume” for the pivot and “Group” for the slicer
- Add a title box for each keyword pivot & slicer set

Lastly, to take this one step further, it’s very easy to add charts to your pivot tables and slice those too. This is a great way to present a group of keywords and showcase their ranking movement month on month, or the historical search volume.
Quick example of how that can look:

All of the above can also been done in Google Sheets.
Note that you will have less control over slicers in Google Sheets and it doesn’t suit keyword lists as well as Excel does, however, if you are just wanting to showcase some numbers and graphs, like the above image, it can be a great option as it’s much easier to share around.
Google has a quick guide on how to slice data in sheets. It’s basically the same process as it is in Excel. Check it out here:
https://support.google.com/docs/answer/9245556?hl=en
I hope this guide has helped you learn how to do keyword research and compile some killer keyword lists for SEO and/or even paid search!